1. Choose “Export Data” in the upper right-hand corner
2. Select “Page views” and “All days” (or any specific day)
3. Create a Pivot Table in Excel by clicking “Insert > Recommended Pivot Tables > select one that starts with ‘Count of PKey”
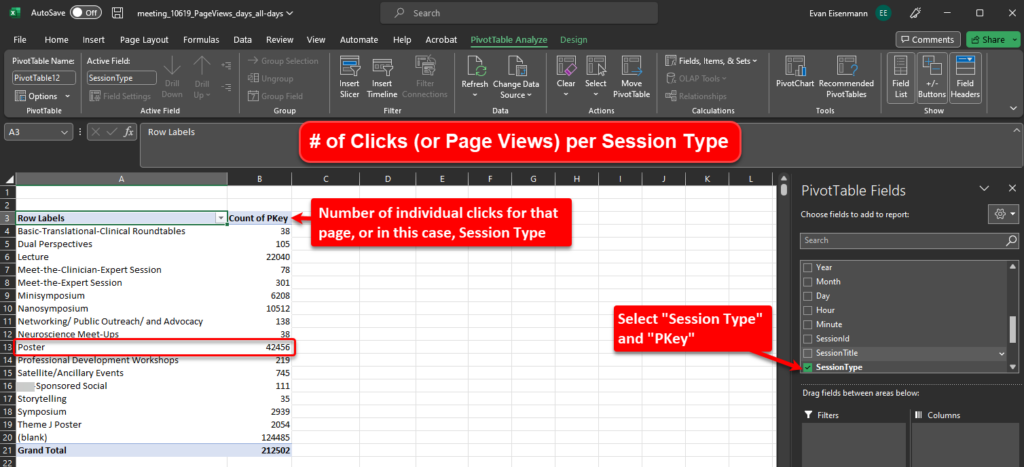
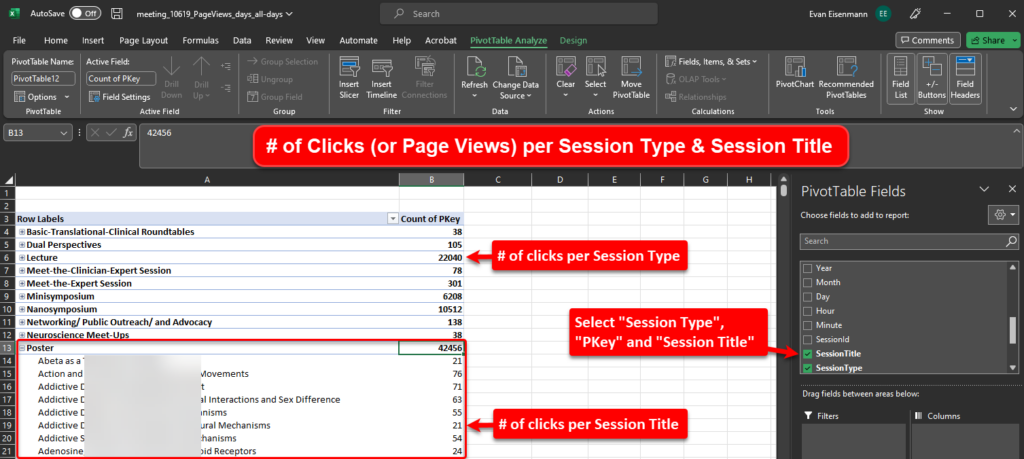
4. In the Pivot Table, choose the fields “PKey” (number of clicks), “SessionType” and “SessionTitle”
Total clicked per Session Type with Grand Total at the bottom:

Adding “SessionTitle” to the Pivot Table allows you to document how many views each session received shown below:

Adding more Pivot Table Fields like Presentation Title, Presentation ID, First/Last Name, etc., will narrow this information even more. Select the “PathRaw” field to copy and paste the exact link at the end of the cAttendee URL to view what was clicked.